on
Quantifying reliability and accuracy of machine learning models
Machine learning and Artificial Intelligence have been hot topics for as long as I have been doing research. However, more often than not, I see new papers focusing on prediction or classification accuracy, with less emphasis on understanding the generalization capabilities of models. More models, more data, more applications… The innovation is driven by increased accuracy on benchmark datasets. While there is a lower bound for the amount of data, and the complexity of a model, that are necessary to learn the data generating function, perhaps the need for ever bigger datasets and models points to our lack of understanding of the basic principles about the systems that are studied through machine learning models. Perhaps, if we use more appropriate models, with more appropriate inductive biases, we do not need so much for a model to learn?
Another fascinating and important question is out-of-distribution (OOD) generalization, where the the training and test data are sampled from different distributions, with potentially different support. In our recent work [1], we discussed a statistical testing framework to quantify the representativeness of a prediction during inference, i.e. when there is no ground truth to contrast our predictions against.
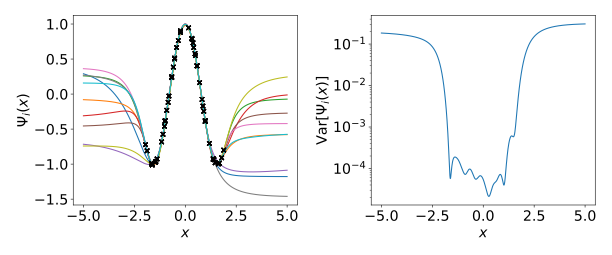
First we need to observe that an ensemble of models, trained on bootstrapped versions of training data with a finite support, disagrees more on the estimates of the data-generating function, as the test samples diverge from the training setting.
For example, let us train an ensemble of 10 overparameterized feed forward neural networks ${ \Psi_m(x) }$ trained independently to approximate $\mathcal{F}(x)=\cos{2x}$ within the range $[-2,2]$ (50 training samples are indicated with black circles).

In $\textbf{a)}$, we see that predictions of the models within the training range overlap, but outside the training range diverge.$ \textbf{b)}$ shows sample variance across ensemble of neural networks ${ \Psi_m(x) }$.
One possible statistic to quantify acceptable amount of model variance is the variance across neural networks in the prediction, i.e. $d({x}_i) = \text{Var}({\Psi}_m({x}))$ — the variance term in the bias-variance decomposition. Since we expect the variance across models to increase, i.e. to fall to the right of the null distribution $f_d(\xi)$, an appropriate significance test is right-tailed. A null hypothesis $H_0$ tests whether, for a given test data point $x’$, a corresponding value of the $d$-statistic, $d’$ comes from a null distribution $f_d(\xi)$ that is generated by the null model. We reject this hypothesis if the $p$-value, defined as
$p:= 1 - \int_0^{d’}f_d(\xi)\text{d} \xi \equiv \int_{d’}^{\infty}f_d(\xi)\text{d} \xi \leq \alpha$.
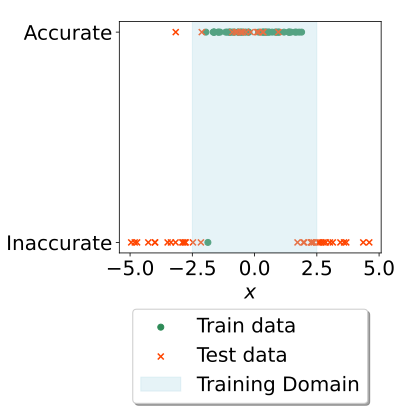
Running this statistical test with $\alpha=0.05$ for the abovementioned example, we find that the model accepts almost all datapoints within the training data’s range (shaded in blue), and rejects all datapoints outside the range (unshaded region).

While we have developed this framework primarily for evaluating accuracy of predictions of dynamics using graph neural networks, I it could be used for any machine learning models - here it was used for simple feed-forward neural networks aimed at approximating a simple 1-dimensional function.